我们在之前的 Leaflet 入门 和 图层组与事件处理 的章节当中已经简单的介绍过了 Leaflet 的基本用法,所以在本章当中我们来了解一下如何使用 Leaflet 来加载 GeoJSON 数据
GeoJSON
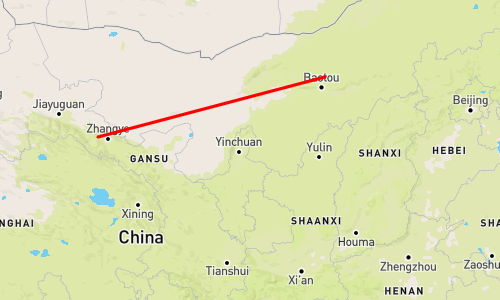
我们先从如何加载 GeoJSON 数据开始看起,其实在 Leaflet 当中,我们可以直接使用 L.geoJson() 方法来对 GeoJSON 数据进行处理,用来绘制各种形式的几何图形,比如下面我们定义一个简单的 GeoJSON 对象,它是一条简单的直线
1
2
3
4
5
6
7
8
9
10
11
12
13
| var geojson_line = {
type: 'Feature',
geometry: {
type: 'LineString',
coordinates: [
[100, 39],
[110, 41],
],
},
properties: {},
id: 1,
}
|
我们通过上面代码定义了一个简单的 GeoJSON 对象,其中的空间几何信息用于定位几何要素,属性信息用于修饰几何要素(属于可选),下面我们只需要调用 L.geoJson() 方法来实例化我们的对象数据即可,这里我们暂时将代码进行拆分,方便我们的理解,而后续我们将会采用连缀的简写方式
1
2
3
4
5
|
var lineLayer = L.geoJson(geojson_line)
lineLayer.addTo(map)
|
最终效果是下面这样的
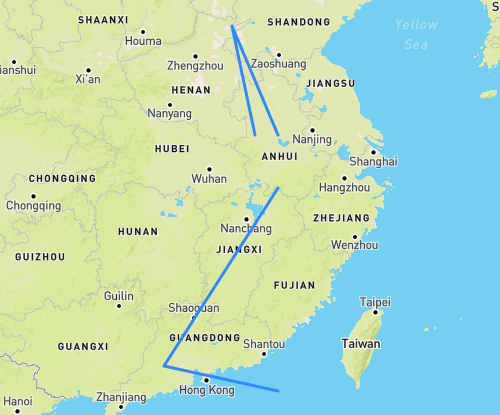
此外,第一个参数除了可以是 feature 对象外也可以是 collection 对象,比如下面这样
1
2
3
4
5
6
7
8
9
10
11
12
13
14
15
16
17
18
19
20
21
22
23
| var myLines = {
type: 'GeometryCollection',
geometries: [
{
type: 'LineString',
coordinates: [
[116.2882028929, 31.864942016],
[115.2882028929, 35.864942016],
[117.2882028929, 31.864942016],
],
},
{
type: 'LineString',
coordinates: [
[117.2882028929, 29.864942016],
[112.2882028929, 22.864942016],
[117.2882028929, 21.864942016],
],
},
],
}
L.geoJson(myLines).addTo(map)
|
效果是下面这样的
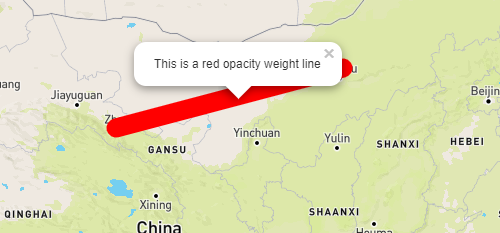
另外还可以添加信息提示
1
2
3
4
5
6
7
8
9
10
11
12
13
14
15
16
| var geojson_line = {
type: 'Feature',
geometry: {
type: 'LineString',
coordinates: [
[100, 39],
[110, 41],
],
},
properties: {
popupInfo: 'This is a red opacity weight line',
},
id: 1,
}
L.geoJson(geojson_line).bindPopup(geojson_line.properties.popupInfo).addTo(map)
|
效果是下面这样的
GeoJSON 中的 options
接着我们再来看看 L.geoJson() 方法中的第二个参数,也就是所谓的 options,使用它可以使几何图形具有可定制性和动态性,这里我们主要介绍三个属性,如下
下面我们就先从绘制点开始看起
绘制点
我们都知道,一个 GeoJSON 对象有三个基本属性,即 type、properties 和 geometry,而且 properties 中是可以自定义任意属性的,如下我们利用 GeoJSON 在地图之上绘制一个点
1
2
3
4
5
6
7
8
9
10
11
12
13
14
15
16
| var geojsonFeature_point = {
type: 'Feature',
properties: {
name: 'Coors Field',
amenity: 'Baseball Stadium',
popupContent: 'this is a point By Geojson',
},
geometry: {
type: 'Point',
coordinates: [117.2882028929, 31.864942016],
},
}
L.geoJson(geojsonFeature_point)
.bindPopup(geojsonFeature_point.properties.popupContent)
.addTo(map)
|
效果是下面这样的
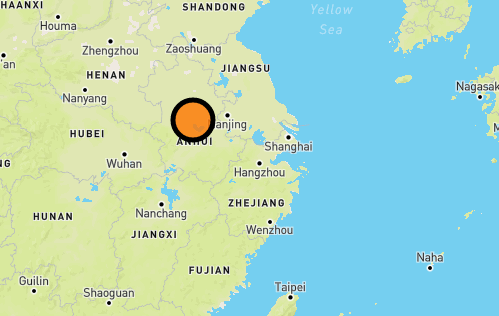
此时我们就可以利用 L.geoJson() 方法中的第二个参数来自定义点的样式,这里我们设置 pointToLayer 属性来重新设置点样式
1
2
3
4
5
6
7
8
9
10
11
12
13
14
15
16
17
18
19
20
21
22
23
24
25
26
27
28
29
| var geojsonFeature_point = {
type: 'Feature',
properties: {
name: 'Coors Field',
amenity: 'Baseball Stadium',
popupContent: 'this is a point By Geojson',
},
geometry: {
type: 'Point',
coordinates: [117.2882028929, 31.864942016],
},
}
var geojsonMarkerOptions = {
radius: 8,
fillColor: '#ff7800',
color: '#000',
weight: 1,
opacity: 1,
fillOpacity: 0.8,
}
L.geoJson(geojsonFeature_point, {
pointToLayer: function (feature, latlng) {
return L.circleMarker(latlng, geojsonMarkerOptions)
},
})
.bindPopup(geojsonFeature_point.properties.popupContent)
.addTo(map)
|
最终效果是下面这样的
style 属性
这个理解起来比较简单,也就是以属性的方式改变样式,我们直接来看代码
1
2
3
4
5
6
7
8
9
10
11
12
13
14
15
16
17
18
19
20
21
22
23
24
25
26
27
28
29
| var myLines = {
type: 'GeometryCollection',
geometries: [
{
type: 'LineString',
coordinates: [
[116.2882028929, 31.864942016],
[115.2882028929, 35.864942016],
[117.2882028929, 31.864942016],
],
},
{
type: 'LineString',
coordinates: [
[117.2882028929, 29.864942016],
[112.2882028929, 22.864942016],
[117.2882028929, 21.864942016],
],
},
],
}
var myStyle = {
color: '#ff7800',
weight: 25,
opacity: 1,
}
L.geoJson(myLines, { style: myStyle }).addTo(map)
|
同样的,我们也可以定义一个函数,用来返回特定样式
1
2
3
4
5
6
7
8
9
10
11
12
13
14
15
16
17
18
19
20
21
22
23
24
25
26
27
28
29
30
31
32
33
34
35
36
37
38
39
40
41
42
43
44
45
| var states = [
{
type: 'Feature',
properties: { party: 'Republican' },
geometry: {
type: 'Polygon',
coordinates: [
[
[104.05, 48.99],
[97.22, 48.98],
[96.58, 45.94],
[104.03, 45.94],
[104.05, 48.99],
],
],
},
},
{
type: 'Feature',
properties: { party: 'Democrat' },
geometry: {
type: 'Polygon',
coordinates: [
[
[109.05, 41.0],
[102.06, 40.99],
[102.03, 36.99],
[109.04, 36.99],
[109.05, 41.0],
],
],
},
},
]
L.geoJson(states, {
style: function (feature) {
switch (feature.properties.party) {
case 'Republican':
return { color: '#ff0000' }
case 'Democrat':
return { color: '#0000ff' }
}
},
}).addTo(map)
|
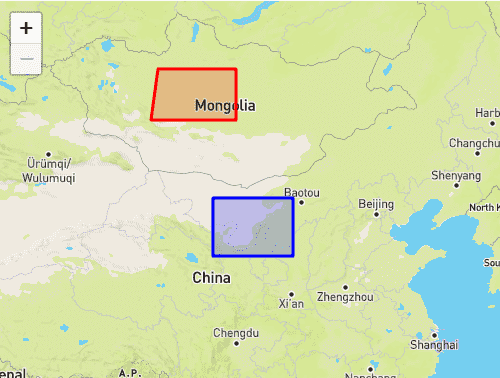
效果是下面这样的
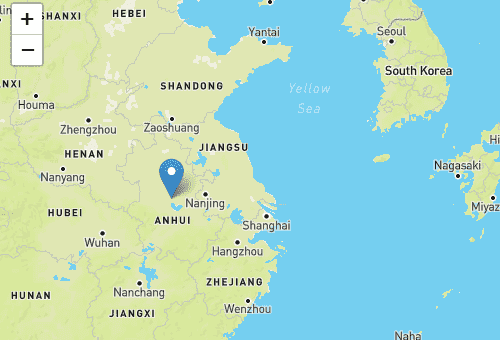
filter 属性
与我们上面介绍到到 style 属性的函数使用方式十分类似,顾名思义 filter 属性只是通过一个函数来进行过滤,通过返回 true 或 false 的值来显示或者隐藏几何图形
1
2
3
4
5
6
7
8
9
10
11
12
13
14
15
16
17
18
19
20
21
22
23
24
25
26
27
28
29
30
| var geojsonFeature_fitler = [
{
type: 'Feature',
properties: {
name: 'Coors Field',
show_on_map: true,
},
geometry: {
type: 'Point',
coordinates: [94.99404, 39.85621],
},
},
{
type: 'Feature',
properties: {
name: 'Busch Field',
show_on_map: false,
},
geometry: {
type: 'Point',
coordinates: [94.98404, 39.74621],
},
},
]
L.geoJson(geojsonFeature_fitler, {
filter: function (feature, layer) {
return feature.properties.show_on_map
},
}).addTo(map)
|
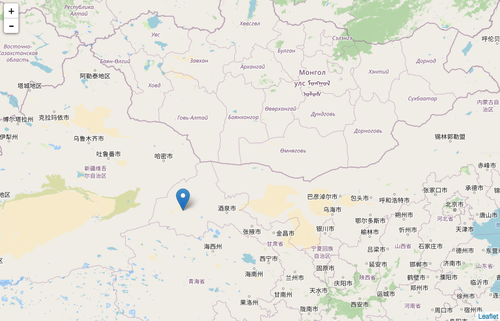
效果是下面这样的
加载离线本地瓦片
最后我们在看来一个算是 Leaflet 的附加功能,那就是加载离线本地瓦片,我们在平常的使用过程当中,各大开源地图库都提供了他们自己的切片服务器,可以通过提供的切片地址加载在线的瓦片,但如果网络较慢,或者服务器出现故障,那么势必影响到调用切片服务的应用,所以在此我们就可以搭建我们自己的切片服务器来解决这样的问题,这里我们就以谷歌切片为例
我们先来看看谷歌的切片规则,我们可以通过谷歌切片下载器,下载瓦片数据,下载之后的数据是以 x_y_z 格式命名的图片,在这里我们只下载级别为一的全球地图即可,当然我们也可以通过上下左右的坐标下载固定区域
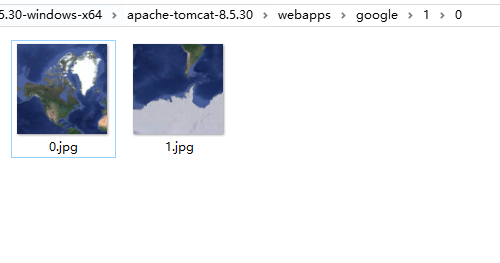
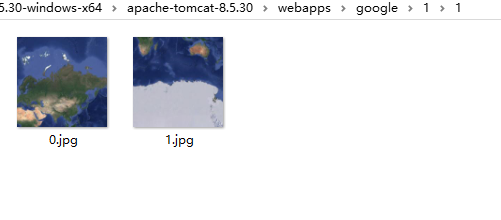
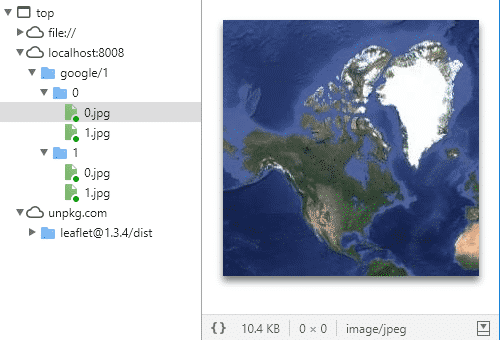
这是我们重命名以后的数据目录,以 z/x/y 的目录为结构,可以看到第一级别总共有四张图片,在坐标系中的位置分别为 (0, 0),(0, 1),(1, 0),(1, 1),也就是从上往下的方式拼图
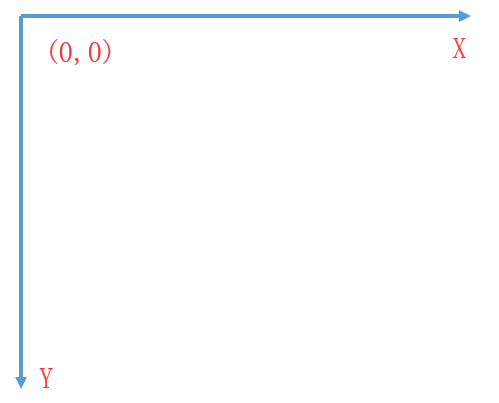
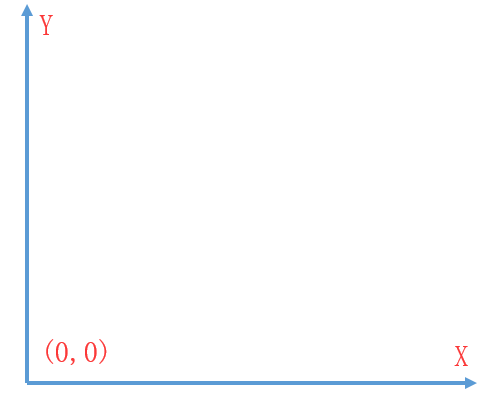
这里需要注意的是,谷歌瓦片是以左上角为圆心,横轴向右 x,竖轴向下 y,而 TMS 则是以左下角为圆心,横轴向右 x,竖轴向上 y
有了瓦片数据以后,我们就可以进行加载切片的操作了,这里我们可以通过 Leaflet 的 L.tileLayer() 方法加载本地切片,只需要将本地切片文件夹部署在服务当中,其中地址中的 {z}/{x}/{y} 分别对应相应的目录顺序,如果文件夹的顺序为 x/y/z,则地址中必须对应
1
2
3
4
5
6
7
8
9
| var Url = 'http://localhost:3000/google/{z}/{x}/{y}.jpg',
Attrib = '离线瓦片',
osm = L.tileLayer(Url, {
minZoom: 1,
maxZoom: 1,
attribution: Attrib,
})
var map = L.map('map').setView([39.919362, 116.407143], 1).addLayer(osm)
|
效果是下面这样的
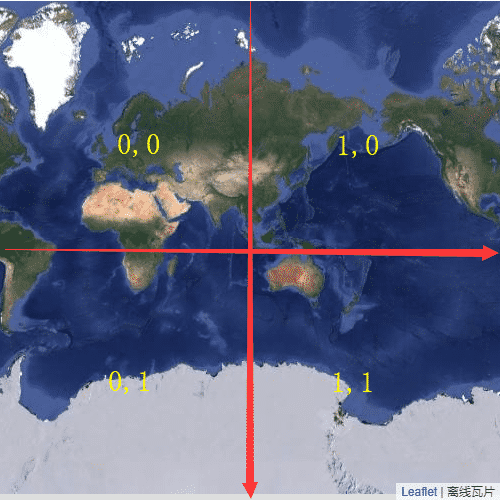
我们也可以打开调试工具,看到当放大到一级别时的四张切片数据以及对应地址
参考